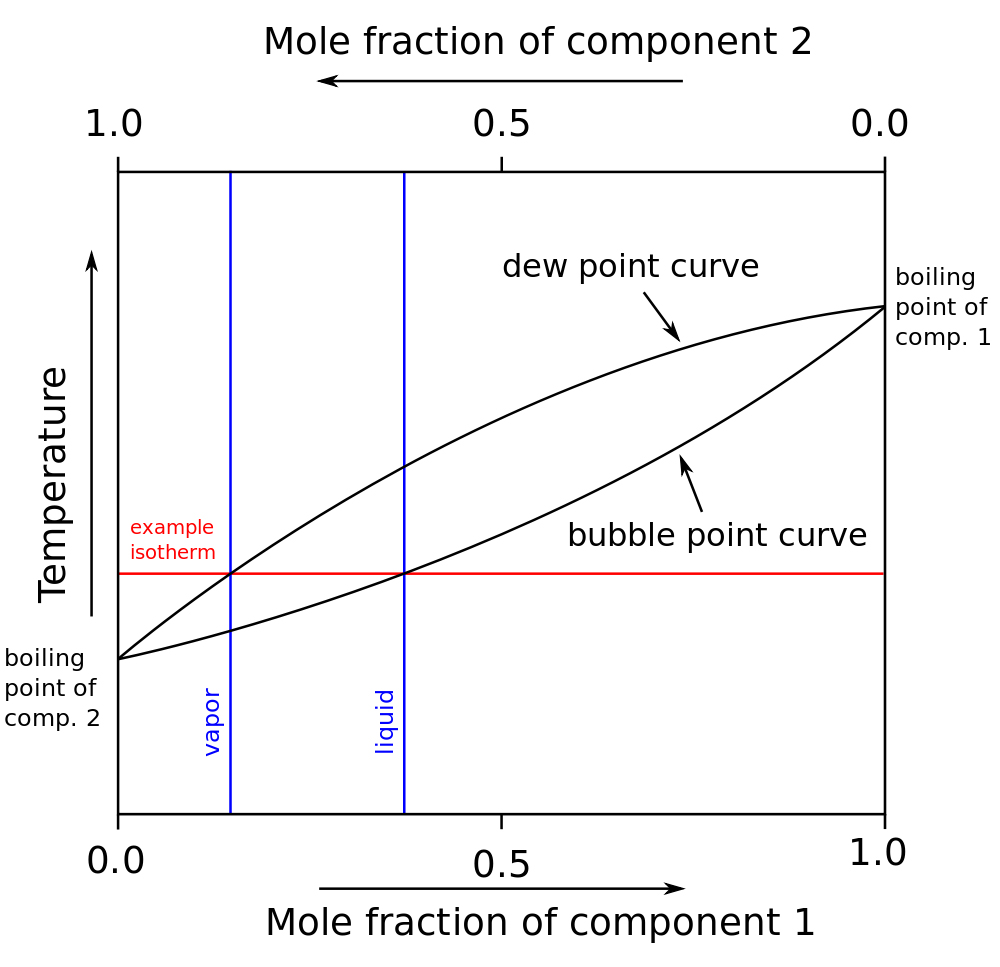
A diagram for a two-component liquid system representing both the variation of the boiling point and the composition of the vapor phase as the liquid-phase composition is varied. A mixture of A and B at composition L₁ would have a boiling point T₁ and a vapor composition V₁, which when condensed would give a liquid at L₂.
L₂ would boil at T₂ to give vapor V₂ equivalent to liquid of composition L₃, and so on. Thus the whole process of either distillation or fractionation of this system will lead to progressive enrichment in component A.
For perfect solutions obeying Raoult’s law the curves would coincide but in real cases there will be sufficient intermolecular attraction to cause deviation from this. The separation of the curves as well as the difference in boiling points determines the performance of fractionation columns.
 مصادر الكيمياء موقع لتعليم الكيمياء بصورة مبسطة
